From Live Data to High-Quality Benchmarks: The Arena-Hard Pipeline
Building an affordable and reliable benchmark for LLM chatbots has become a critical challenge. A high-quality benchmark should 1) robustly separate model capability, 2) reflect human preference in real-world use cases, and 3) frequently update to avoid over-fitting or test set leakage.
Traditional benchmarks are often static or close-ended (e.g., MMLU multi-choice QA), which do not satisfy the above requirements. On the other hand, models are evolving faster than ever, underscoring the need to build benchmarks with high separability.
We introduce Arena-Hard – a data pipeline to build high-quality benchmarks from live data in Chatbot Arena, which is a crowd-sourced platform for LLM evals. To measure its quality, we propose two key metrics:
- Agreement to Human preference: whether the benchmark score has high agreement to human preference.
- Separability: whether the benchmark can confidently separate models.
We compare our new benchmark, Arena Hard Auto v0.1, to a current leading chat LLM benchmark, MT Bench. In Figure 1, we show Arena Hard Auto v0.1 offers significantly stronger separability against MT Bench with tighter confidence intervals. It also has a higher agreement (89.1%, see Table 1) with the human preference ranking by Chatbot Arena (english-only). We expect to see this benchmark useful for model developers to differentiate their model checkpoints.
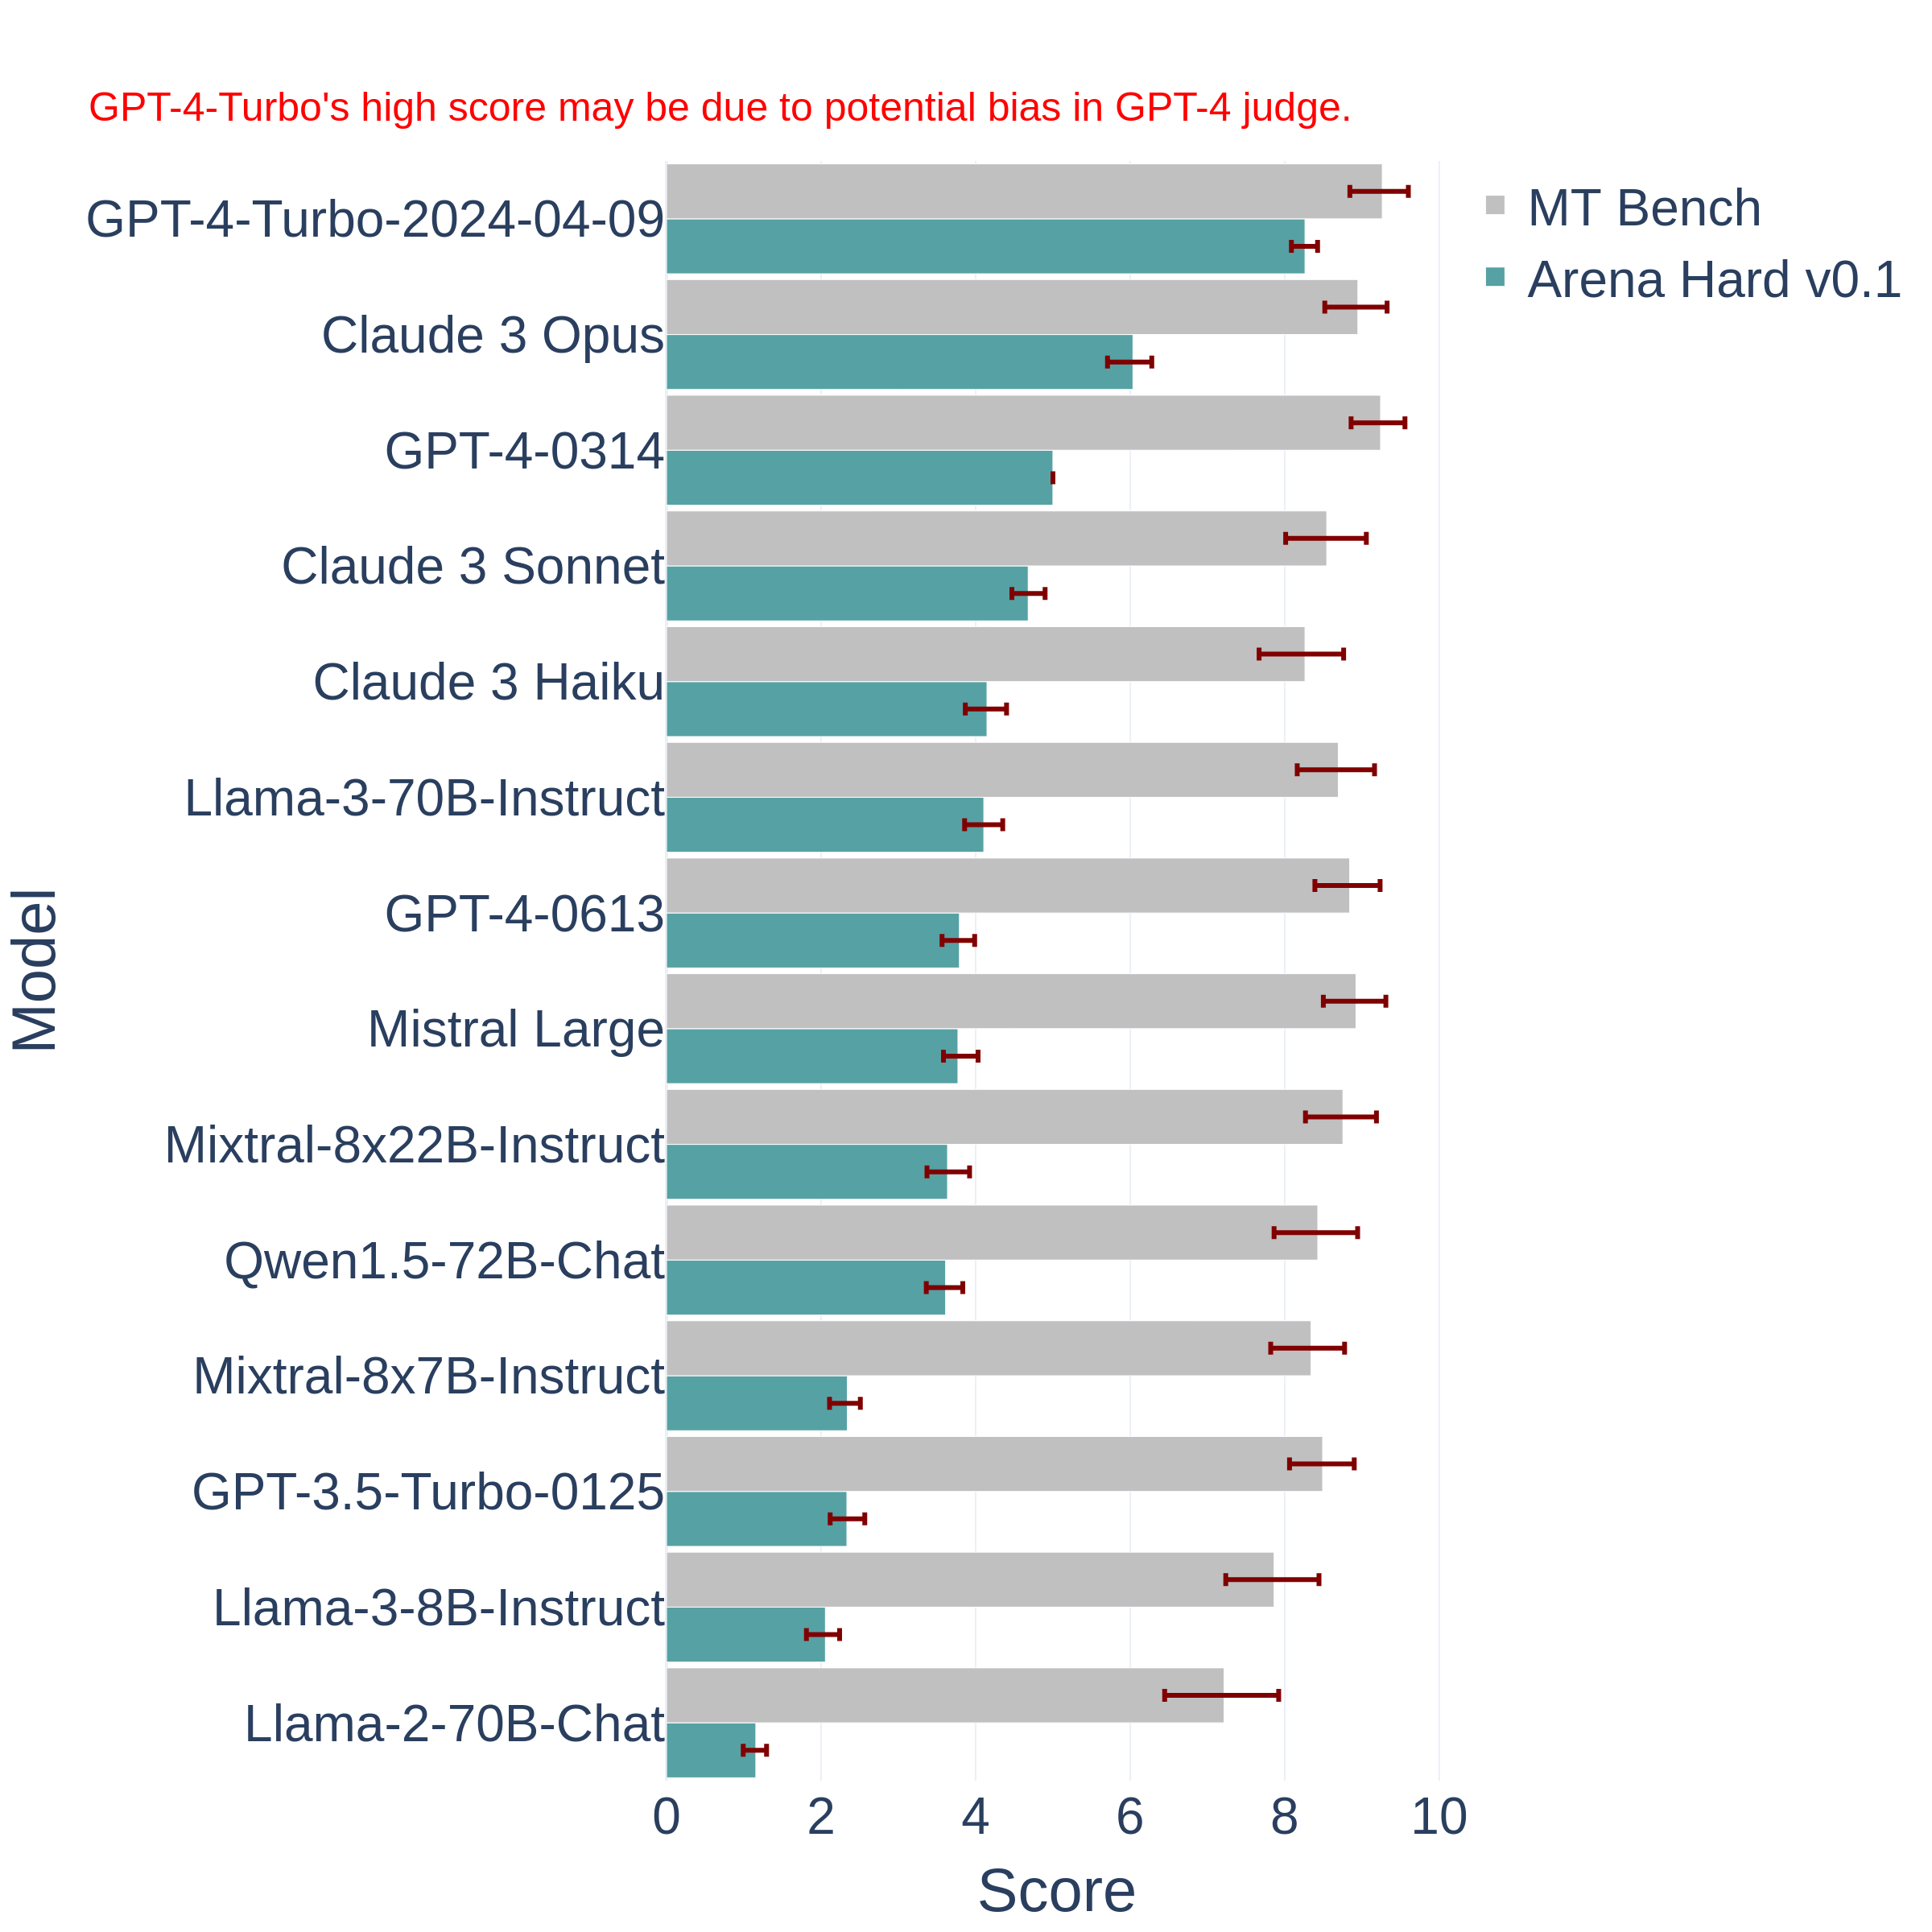
Figure 1: Comparison between MT-bench and Arena Hard Auto v0.1. The latter offers significantly better separability between models and tighter confidence intervals. GPT-4-0314 has no variance in Arena-hard-Auto-v0.1 because it's used as the anchor model.
Links:
- Evaluate your model on Arena-Hard-Auto-v0.1: Link
- Browse Arena-Hard-Auto-v0.1 prompts: Link
- Statistic Notebook Google Colab: Link
- Full leaderboard at the Result section: Skip
We explain more technical details in the following sections.
Key Objectives of LLM benchmarks
We outline a few key properties that an LLM chatbot benchmark should possess to provide a meaningful measurement of capabilities between models:
- Agreement to human preference: It should correlate with human preference in real-world use cases
- Separability: It should provide confidence interval on benchmark score and separate models with high confidence
- Freshness: It should use new, unseen prompts to avoid potential test leakage
We define agreement of Benchmark A with respect to a reference Benchmark B by the below formulation:
For a given model pair (which B can separate with confidence)
- If A can confidently separate the 2 given models
- +1.0 if the rank order agrees with B.
- -1.0 if the rank order disagrees with B.
- +0.0 if A cannot separate the 2 given models with confidence
An agreement score of 1 implies benchmark A confidently agrees on the preference of every single unique models pair. On the other hand, an agreement score of -1 implies benchmark B confidently disagrees on the preference of every single unique models pair instead.
We define separability by whether a benchmark can separate given model pairs with derived confidence intervals (via bootstrapping). This metric can also serve to measure the variances in ranking outputs provided by a benchmark. We quantify this metric by the percentage of model pairs which have non-overlapping confidence intervals of the benchmark scores.
We use a set of top-20 models* on Chatbot Arena (April 13, 2024) that are presented on AlpacaEval leaderboard to calculate separability and agreement per benchmark. We consider the human preference ranking by Chatbot Arena (English only) as the reference to calculate agreement.
In Table 1, Arena-hard-Auto-v0.1 shows the highest separability (87.4%) against widely adopted LLM benchmarks and offers highest agreement (89.1%) to Chatbot Arena. It is also cheap and fast to run ($25).
Interestingly, we find Spearman Correlation, a popular metric for measuring correlations between rankings, may be an unreliable metric for ranking correlation as it does not consider variance of the rankings, and therefore fails to adequately punish essential ranking granularities of the top models we care about most. For example, when considering 95% CI, MT-bench’s agreement to Chatbot Arena drops from 91.3% to 22.6%.
You can find full statistics in the result section.
Table 1. Separability and agreement per benchmark.
| Chatbot Arena (English-only) |
MT-bench | AlpacaEval 2.0 LC (Length Controlled) |
Arena-Hard-Auto-v0.1 | |
|---|---|---|---|---|
| Avg #prompts per model eval | 10,000+ | 160 | 800 | 1,000 |
| Agreement to Chatbot Arena with 95% CI | N/A | 26.1% | 81.2% | 89.1% |
| Spearman Correlation | N/A | 91.3% | 90.8% | 94.1% |
| Separability with 95% CI | 85.8% | 22.6% | 83.2% | 87.4% |
| Real-world | Yes | Mixed | Mixed | Yes |
| Freshness | Live | Static | Static | Frequent Updates |
| Eval cost per model | Very High | $10 | $10 | $25 |
| Judge | Human | LLM | LLM | LLM |
*Results based on 20 top models from Chatbot Arena that are also presented on Alpaca Eval
gpt-4-turbo-2024-04-09, claude-3-opus-20240229, claude-3-sonnet-20240229, gpt-4-0314, gpt-4-0613, mistral-large-2402, qwen1.5-72b-chat, mistral-medium, claude-2.0, gpt-3.5-turbo-0613, claude-2.1, gemini-pro, mixtral-8x7b-instruct-v0.1, gpt-3.5-turbo-0314, yi-34b-chat, tulu-2-dpo-70b, dbrx-instruct-preview, vicuna-33b, starling-lm-7b-alpha, llama-2-70b-chatNext, we elaborate how to build the prompt selection pipeline to ensure data quality.
Arena-Hard Pipeline
We build a pipeline that automatically extracts quality prompts from a dataset of 200,000 user queries collected via Chatbot Arena. This process involves ensuring:
- Diversity: Prompt set should cover a wide range of real-world topics
- Prompt quality: Each prompt should possess high quality to benchmark LLMs. we define several key criteria below (see Table 2)
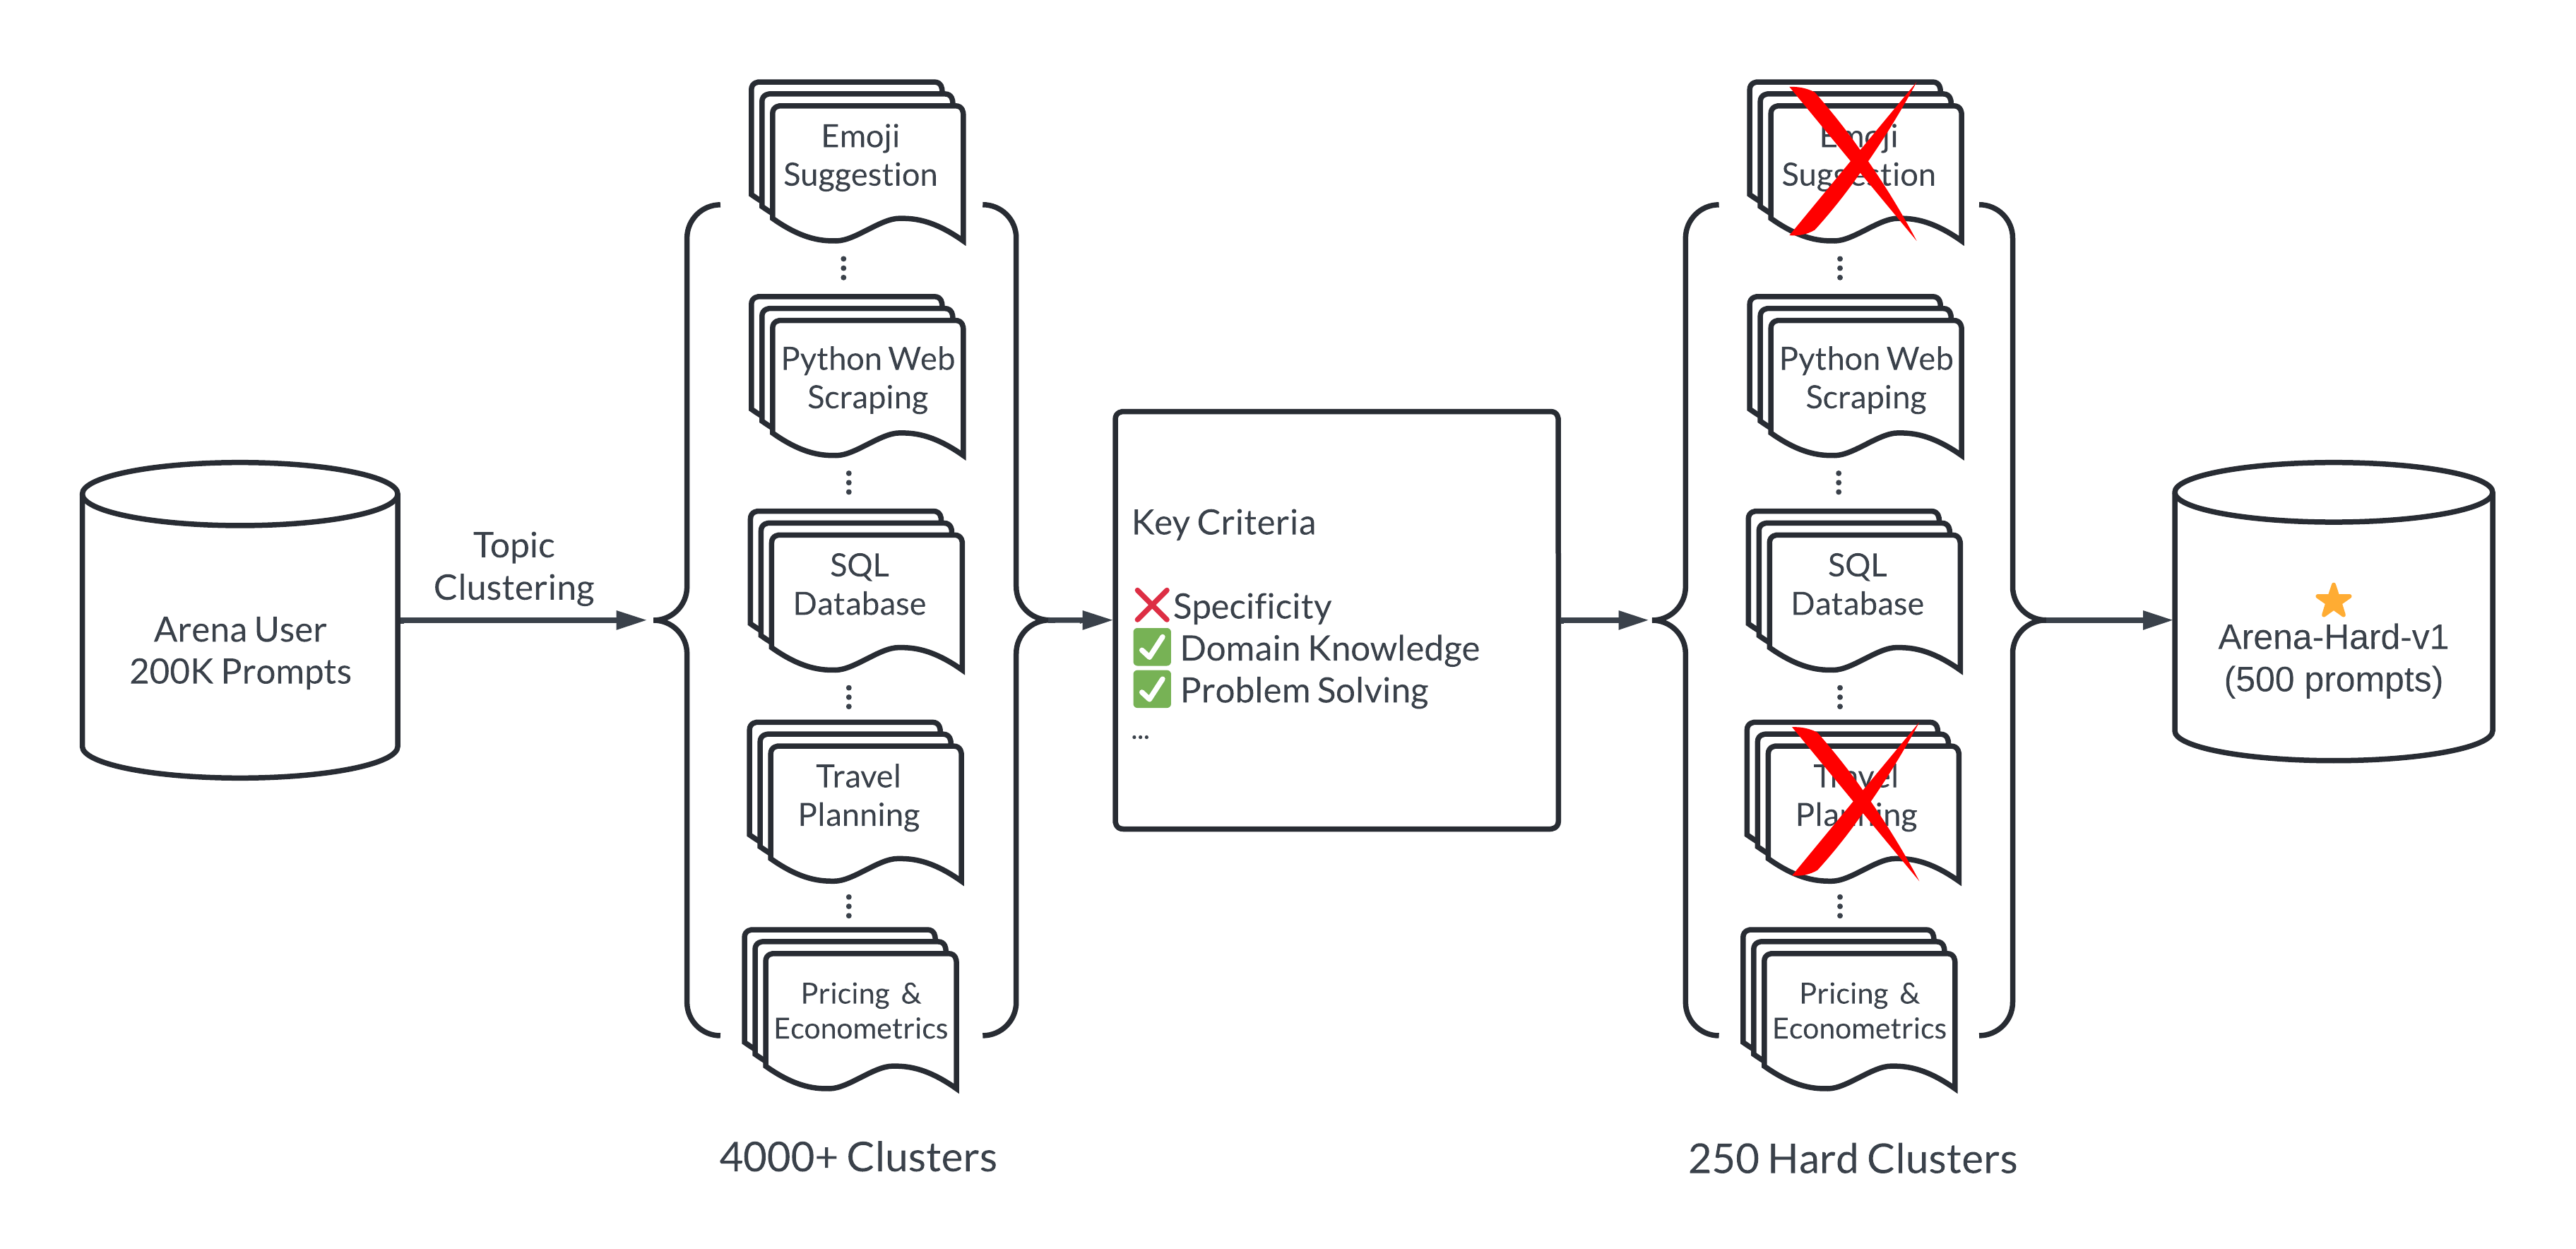
Figure 2: Arena-Hard Pipeline
To ensure prompt diversity, we adopt a topic modeling pipeline in BERTopic by first converting each prompt with OpenAI’s embedding (text-embedding-3-small), reducing dimension with UMAP, and using a hierarchical-based clustering algorithm (HDBSCAN) to identify clusters which are then summarized using GPT-4-turbo. This helps us identify over 4000 topics covering a wide range of domains. However, topic clusters come with varying quality and separability in benchmarking LLMs. We then develop a calibrated system prompt for LLMs to help us select high quality user queries by seven key criteria (e.g., specificity, domain knowledge, problem-solving, etc).
| Table 2: 7 Key Criteria |
|---|
| 1. Specificity: Does the prompt ask for a specific output? |
| 2. Domain Knowledge: Does the prompt cover one or more specific domains? |
| 3. Complexity: Does the prompt have multiple levels of reasoning, components, or variables? |
| 4. Problem-Solving: Does the prompt directly involve the AI to demonstrate active problem-solving skills? |
| 5. Creativity: Does the prompt involve a level of creativity in approaching the problem? |
| 6. Technical Accuracy: Does the prompt require technical accuracy in the response? |
| 7. Real-world Application: Does the prompt relate to real-world applications? |
An LLM Judge (GPT-3.5-Turbo, GPT-4-Turbo) annotates each prompt from 0 to 7 to indicate how many criteria are met. We then score each cluster by the average score of its prompts. Below, we show examples of topic clusters ranging from low to high mean scores. We can observe clusters with higher scores often correlate to challenging topics or tasks for LLMs like game development or mathematical proofs. On the other hand, clusters with lower scores point to trivial or ambiguous questions like "Design Styles and Influences".
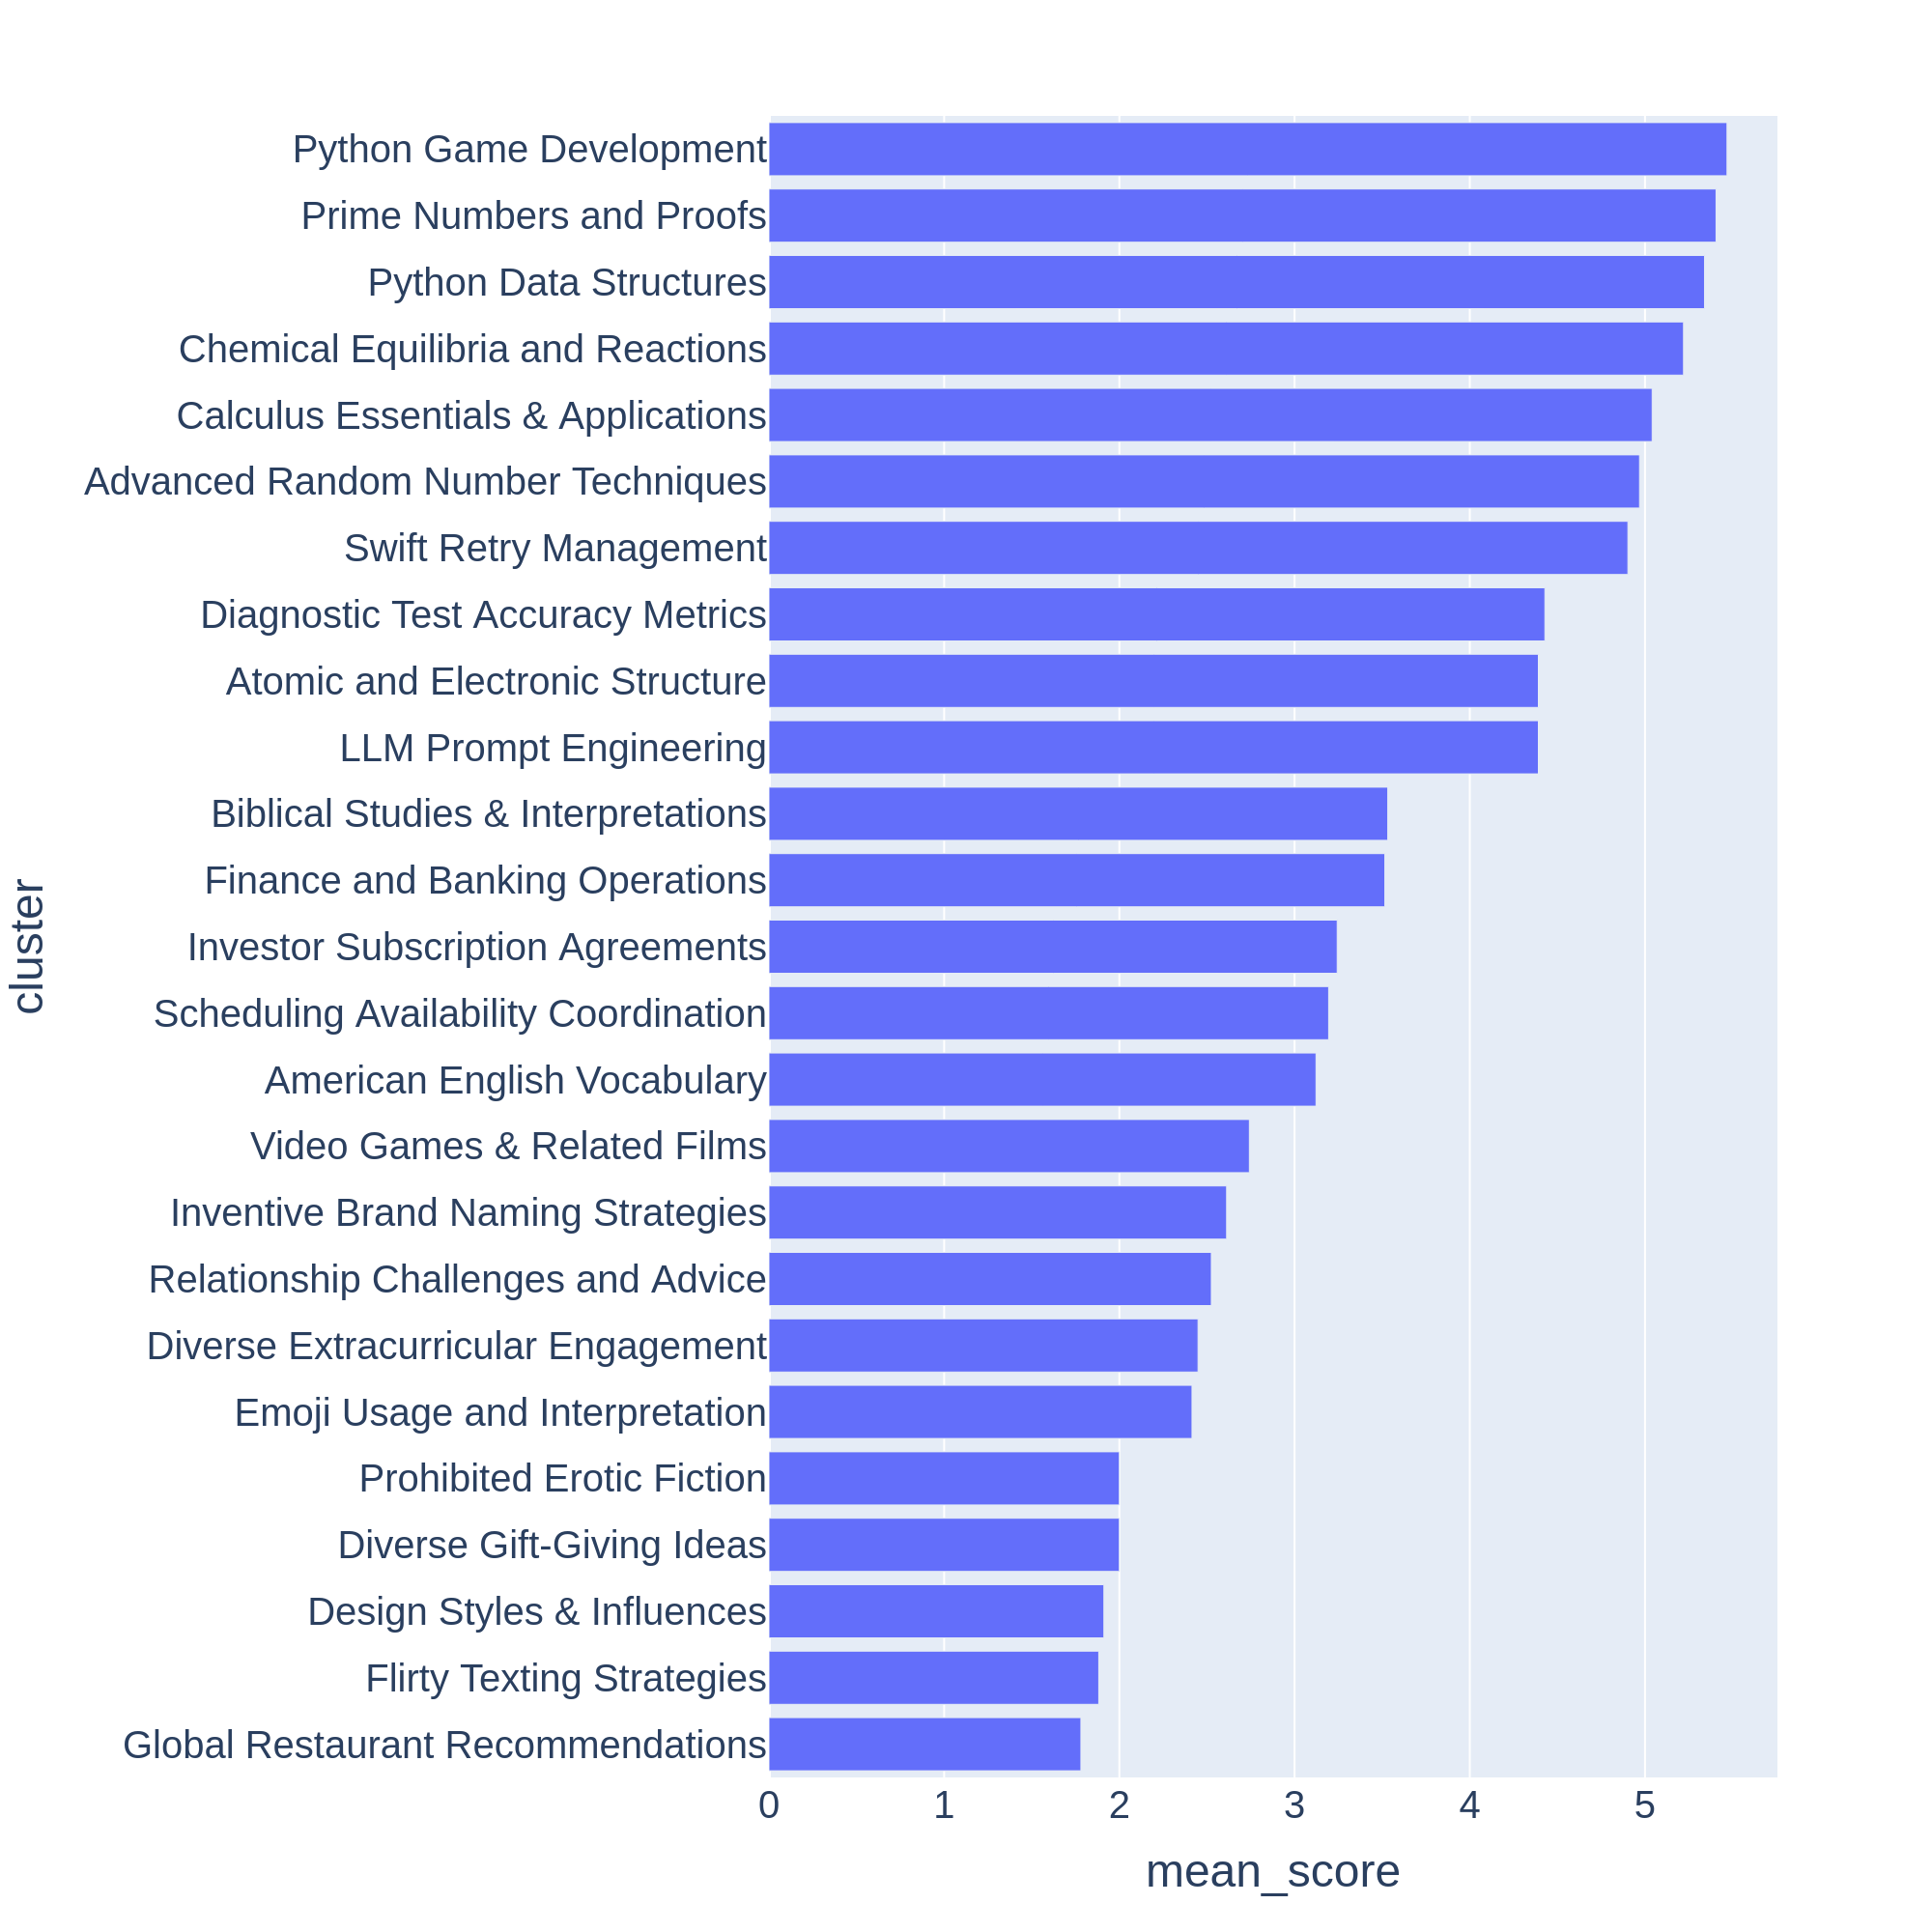
Figure 3: Chatbot Arena clusters sorted by their scores.
To see whether the prompt score correlates with separability, we sample 50 prompts per score and compare the responses from GPT-4 and Llama-70b, with GPT-4-Turbo as judge. We observe a strong correlation between high potential score and the win-rate of GPT-4 over Llama-70b. A similar trend is also observed in other model pairs such as Claude Sonnet vs Haiku and Mistral-large vs Mixtral.
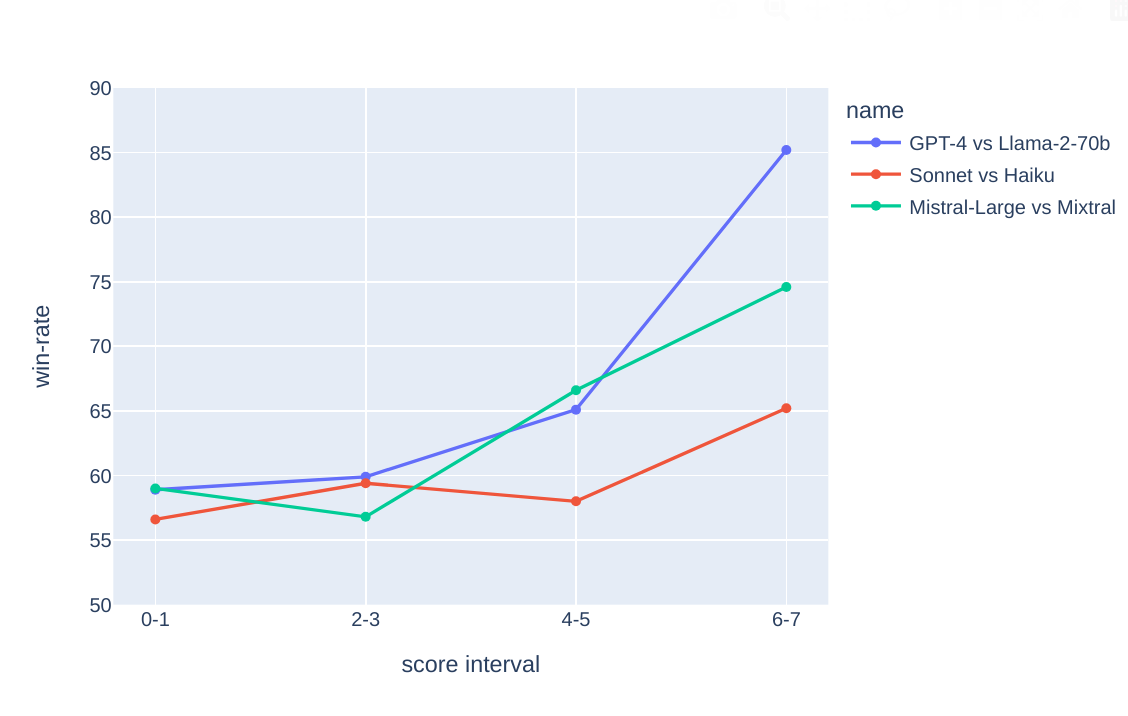
Figure 4: Win-rate between model pairs becomes more separable as the "7 Key Criteria" score increases.
Results
Arena-Hard-Auto-v0.1
Using the above pipeline, we identify 250 high-quality topic clusters with mean score >=6 out of 7. We then randomly sample 2 prompts per cluster to construct 500 high-quality benchmark prompts, Arena-Hard-Auto-v0.1. This benchmark set contains mostly well-defined, technical problem-solving queries as required in the above key criteria. You can browse all the prompts at this link.
However, evaluating models on challenging queries such as Arena-Hard-Auto-v0.1 is a non-trivial task. Most queries involve deep domain knowledge and problem solving skills, requiring expert-level judgment to evaluate the answer quality. Unfortunately, this is prohibitively expensive and time consuming. Following LLM-as-a-Judge and AlpacaFarm, we employ LLM as a judge framework to approximate human preference.
We consider the pairwise comparison setup against a strong baseline model (GPT-4-0314), and ask a strong judge model (e.g., GPT-4-Turbo or Claude-3-Opus) to categorize the preference into five labels: A >> B, A > B, A~=B, .. B>>A. This way, a model will be penalized more in big losses than small losses, which we find to be effective in separating models. We also employ CoT to prompt the LLM judge to generate answers first before giving judgments. Full judge prompt can be found here.
To avoid potential position bias, we adopt a two-game setup – per query we swap the models on the first & second position. This results in 500x2=1000 judgments per model evaluation. Following Chatbot Arena, we adopt the Bradley-Terry model to produce model’s the final model scores. By bootstrapping the comparisons from all models, we find it to be statistically stable compared to only considering win-rate against the baseline model.
Full Leaderboard with GPT-4-Turbo as judge
We use gpt-4-1106-preview as the judge model to generate judgment for the model response against baseline. We take all the comparisons and compute each model’s Bradley-Terry coefficient. We then transform it to win-rate against the baseline as the final score. The 95% confidence interval is computed via 100 rounds of bootstrapping.
Arena Hard Auto v0.1 Leaderboard (baseline: GPT-4-0314)
| Model Name | Score | 95% CI | Average #Tokens |
|---|---|---|---|
| gpt-4-turbo-2024-04-09* | 82.6 | -1.8/+1.6 | 662 |
| gpt-4-0125-preview* | 78.0 | -2.2/+2.4 | 619 |
| claude-3-opus-20240229 | 60.4 | -3.3/+2.4 | 541 |
| gpt-4-0314 | 50.0 | -0.0/+0.0 | 423 |
| claude-3-sonnet-20240229 | 46.8 | -2.1/+2.2 | 552 |
| claude-3-haiku-20240307 | 41.5 | -2.8/+2.5 | 505 |
| llama-3-70b-instruct | 41.1 | -2.5/+2.4 | 583 |
| gpt-4-0613 | 37.9 | -2.2/+2.0 | 354 |
| mistral-large-2402 | 37.7 | -1.9/+2.6 | 400 |
| mixtral-8x22b-instruct-v0.1 | 36.4 | -2.7/+2.9 | 430 |
| Qwen1.5-72B-Chat | 36.1 | -2.5/+2.2 | 474 |
| command-r-plus | 33.1 | -2.1/+2.2 | 541 |
| mistral-medium | 31.9 | -2.3/+2.4 | 485 |
| mistral-next | 27.4 | -2.1/+1.7 | 297 |
| gpt-3.5-turbo-0613 | 24.8 | -1.6/+2.0 | 401 |
| claude-2.0 | 24.0 | -2.5/+2.5 | 295 |
| dbrx-instruct | 23.9 | -1.4/+1.5 | 415 |
| Mixtral-8x7B-Instruct-v0.1 | 23.4 | -2.3/+1.7 | 457 |
| gpt-3.5-turbo-0125 | 23.3 | -2.2/+2.3 | 329 |
| Yi-34B-Chat | 23.1 | -1.8/+2.0 | 611 |
| Starling-LM-7B-beta | 23.0 | -1.9/+2.2 | 530 |
| claude-2.1 | 22.8 | -1.6/+2.1 | 290 |
| Snorkel-Mistral-PairRM-DPO | 20.7 | -2.2/+1.5 | 564 |
| llama-3-8b-instruct | 20.6 | -2.5/+1.8 | 585 |
| gpt-3.5-turbo-1106 | 18.9 | -1.6/+2.1 | 285 |
| gpt-3.5-turbo-0301 | 18.1 | -1.7/+1.2 | 334 |
| gemini-1.0-pro | 17.8 | -1.7/+1.7 | 322 |
| command-r | 17.0 | -1.9/+1.7 | 432 |
| tulu-2-dpo-70b | 15.0 | -1.4/+1.2 | 550 |
| Starling-LM-7B-alpha | 12.8 | -1.4/+1.4 | 483 |
| mistral-7b-instruct-v0.2 | 12.6 | -1.6/+1.3 | 541 |
| Llama-2-70b-chat-hf | 11.6 | -1.6/+1.4 | 595 |
| vicuna-33b-v1.3 | 8.6 | -1.3/+1.0 | 451 |
| gemma-7b-it | 7.5 | -1.1/+1.2 | 378 |
| Llama-2-7b-chat-hf | 4.6 | -0.8/+0.8 | 561 |
| gemma-2b-it | 3.0 | -0.6/+0.7 | 369 |
GPT-4-Turbo or Claude as Judge?
We also compare two strongest LLMs: GPT-4-1106-Preview and Claude-3 Opus as the judge mode in Table 3. When GPT-4 Judge is used, we observe higher separability across models (ranging from 23.0 to 78.0). When Claude Judge is used, we find the Claude family of models scores in general go up, despite it still favoring gpt-4-0125-preview over itself. Surprisingly, it favors several open models (Mixtral, Yi, Starling) or even gpt-3.5-turbo over gpt-4-0613.
Table 3. Leaderboard Comparison Between GPT and Claude as Judge
| Model Name | GPT-4-1106-Preview Judge | Claude-3-Opus Judge |
Diff |
|---|---|---|---|
| gpt-4-0125-preview | 78.0 | 76.3 (↓) | -1.7 |
| claude-3-opus-20240229 | 60.4 | 71.8 (↑) | +11.4 |
| claude-3-sonnet-20240229 | 46.8 | 63.6 (↑) | +16.8 |
| claude-3-haiku-20240307 | 41.5 | 56.1 (↑) | +14.6 |
| gpt-4-0613 | 37.9 | 30.6 (↓) | -7.3 |
| gpt-3.5-0613 | 24.8 | 34.7 (↑) | +9.9 |
| mixtral-8x22b-instruct-v0.1 | 23.4 | 34.8 (↑) | +11.4 |
| yi-34b-chat | 23.1 | 46.6 (↑) | +23.5 |
| starling-lm-7b-beta | 23.0 | 45.0 (↑) | +22 |
We further compare GPT-4 and Claude Judges using our proposed metrics of separability and agreement in Table 4, and find that the GPT-4-turbo Judge is significantly better across all metrics.
| Arena-Hard-Auto-v0.1 (GPT-4-1106-Preview Judge) | Arena-Hard-Auto-v0.1 (Claude-3 Judge) | |
| Agreement to Chatbot Arena with 95% CI | 89.1% | 66.7% |
| Separability with 95% confidence intervals | 87.4% | 83.7% |
| Spearman Correlation | 94.2% | 77.0% |
| Brier Score* | 0.07 | 0.17 |
We manually compared different judgment examples between GPT-4-Turbo and Claude as a judge. We found that when the two judges disagreed, it could usually be broken down into two main categories:
- Conservative scoring
- Differing perspectives on the user's prompt
We find that Claude-3-Opus is much less likely to give harsh scores – it is particularly hesitant to proclaim one response as "significantly better" than another. In contrast, GPT-4-Turbo will identify errors in a model's response that led to an incorrect answer and penalize the model with a significantly lower score. On the other hand, Claude-3-Opus sometimes overlooks smaller errors. Even when Claude-3-Opus does identify these errors, it tends to treat them as minor issues and shows leniency during scoring. This effect is particularly present in coding and math problems, where small mistakes are more likely to completely derail the final answer; these scorings are still given leniency from Claude-3-Opus but not GPT-4-Turbo. See the appendix below for specific examples of differing judgments, many of which exhibit this phenomenon.
Figure 5: Score Strength
There is also a small subset of prompts in which Claude-3-Opus and GPT-4-Turbo judge with fundamentally different perspectives. For example, given a coding question, Claude-3-Opus may choose the response that provides the most educational value to the user, offering a simplistic structure without relying on external libraries. GPT-4-Turbo, however, may prioritize the response that provides the most practical answer, regardless of its educational value to the user. While both interpretations are valid judging criteria, we find GPT-4-Turbo’s perspective may be more correlated with the average user.
Despite the observed differences between Claude-3-Opus and GPT-4-Turbo judgment styles, we find the judges have an overall soft agreement rate of 80%. Two judgments “soft agree” if they are at most distance one apart, or in other words they do not contradict.
Limitations
Verbosity: does the LLM Judge prefer longer responses?
LLM as judges are known to suffer from verbosity bias (Length-Controlled AlpacaEval). Below we plot the avg token length and score per model for both MT-Bench and Arena-Hard-Auto-v0.1. Visually, there isn't a strong correlation between score and length.
Figure 6: Verbosity scatterplot comparing Arena-Hard-Auto-v0.1 and MT Bench.
To further examine potential verbosity bias, we conduct an ablation on three different system prompts (original, chatty, detailed) with GPT-3.5-Turbo. We observe that both GPT-4-Turbo and Claude-3-Opus judges may be affected by longer outputs, while Claude being significantly more impacted with a “more detailed” system prompt as GPT-3.5-Turbo reaches a win-rate of over 40% against GPT-4-0314.
Interestingly, the “chatty” system prompt doesn’t affect much on the win-rate by both judges, despite the longer average #tokens. This suggests output length is not the only factor. It is possible that more detailed answers are also more helpful and thus preferred by LLM judges.
Table 5. Length Bias Comparison Between GPT and Claude as Judge
| Model Name | Win Rate | Average Token # |
|---|---|---|
| GPT-4-1106-Preview | ||
| gpt-3.5-turbo-0125-detailed | 29.86 | 421 |
| gpt-3.5-turbo-0125-chatty | 23.89 | 361 |
| gpt-3.5-turbo-0125 | 23.2 | 328 |
| Claude-3-Opus | ||
| gpt-3.5-turbo-0125-detailed | 40.78 | 421 |
| gpt-3.5-turbo-0125-chatty | 28.49 | 375 |
| gpt-3.5-turbo-0125 | 27.97 | 328 |
detailed: “You are a helpful assistant who thoroughly explains things with as much detail as possible.”
chatty: “You are a helpful assistant who is chatty.”
Variance in GPT-4 judgments
We find that even with temperature=0, GPT-4-Turbo may still generate slightly different judgments. Here we repeat the judgments for gpt-3.5-turbo-0125 three times and report its variance. Due to limited budget, we can only evaluate all the models once. We recommend using the confidence intervals to determine model separation.
Table 6. Variances between 3 separate runs of Arena Hard Auto v0.1.
| Model Name | Win Rate | Average Token # |
|---|---|---|
| gpt-3.5-turbo-0125-1 | 23.05 | 328 |
| gpt-3.5-turbo-0125-2 | 22.93 | 328 |
| gpt-3.5-turbo-0125-3 | 22.75 | 328 |
Potential self-bias & prompt selection bias
We also observe potential self-bias in LLM judges (e.g., Claude Judge prefers Claude answers). In addition, the prompt selection process could be biased by the LLMs. The benchmark also does not evaluate multi-turn interactions.
Viewing Benchmarking as a Forecasting Problem
In this section we attempt to combine both confidence and correlation into one standardized metric for benchmarking.
| Arena Hard Auto v0.1 | Chabot Arena* (20K Votes) | MT Bench | Alpaca 2.0 LC |
| 0.07 | 0.08 | 0.09 | 0.11 |
Model developers generally use benchmarks for model selection, not ground truth certification of performance. Benchmarks serve as a cheap and lightweight proxy for more expensive and complex evaluations like ground truth Bradley Terry Coefficients derived from human preference. Thus, we expect benchmarks to tell us, as model developers, some confidence bound on what a model’s real world performance will be. In this sense, a benchmark serves as a forecast for true long-run performance.
Forecasting is a delicate balance between confidence and uncertainty. Therefore, a good benchmark should show confidence when separating clearly unequal models, but should demonstrate uncertainty when ranking differences between legitimately similar models. One might argue we only need to look at how confident a given benchmark is at separating model pairs. A good benchmark is not necessarily always confident at separating models– you don’t want your benchmark to be confidently incorrect. For example, given a pair of models A and B and benchmark 1 and 2. Let’s assume ground truth is model A is better than model B. We bootstrap both benchmark 1 and 2 and retrieve their confidence intervals for both model’s performances. Benchmark 1 confidently predicts model B is better than A while Benchmark 2 predicts model B is better than A with low confidence. In this case, we should say Benchmark 2 is actually better than Benchmark 1 at predicting this pair of models. This is to say, high confidence should be rewarded only when the answer is correct, and low confidence is better when incorrect.
In this problem context, we introduce the prediction criteria as simply the binary indicator 1 for some model pair ( and ). The forecast gives a probability that this indicator is true, . A higher probability forecast indicates greater confidence that 1 will be true. We can generate these probability predictions using bootstrapped score mean and variance, which in turn define a gaussian distribution. We then resolve the ground truth label for 1 using Chatbot Arena's Bradley Terry coefficients.
A well-defined fair-in-expectation loss for forecasting is Brier Score. Brier score rewards confidence when forecasts are correct while punishing confident errors. We can calculate the loss over a benchmark prediction of 1 for each model pair with respect to the Chatbot Area ground truth scores to quantify a benchmark’s forecasting performance. Here we assume Chatbot Arena as “ground truth” as both Alpaca 2.0 LC and Arena Hard Auto are advertised as an inexpensive alternative to Chatbot Arena as an evaluation pipeline. We will conduct future study on correlation comparison where we instead use Chatbot Arena's Bradley Terry coefficient derived from similar distributions as the given benchmark.
We find that Arena Hard Auto averages much lower forecasting loss, demonstrating that it is both accurate in score, and accurate in confidence level.
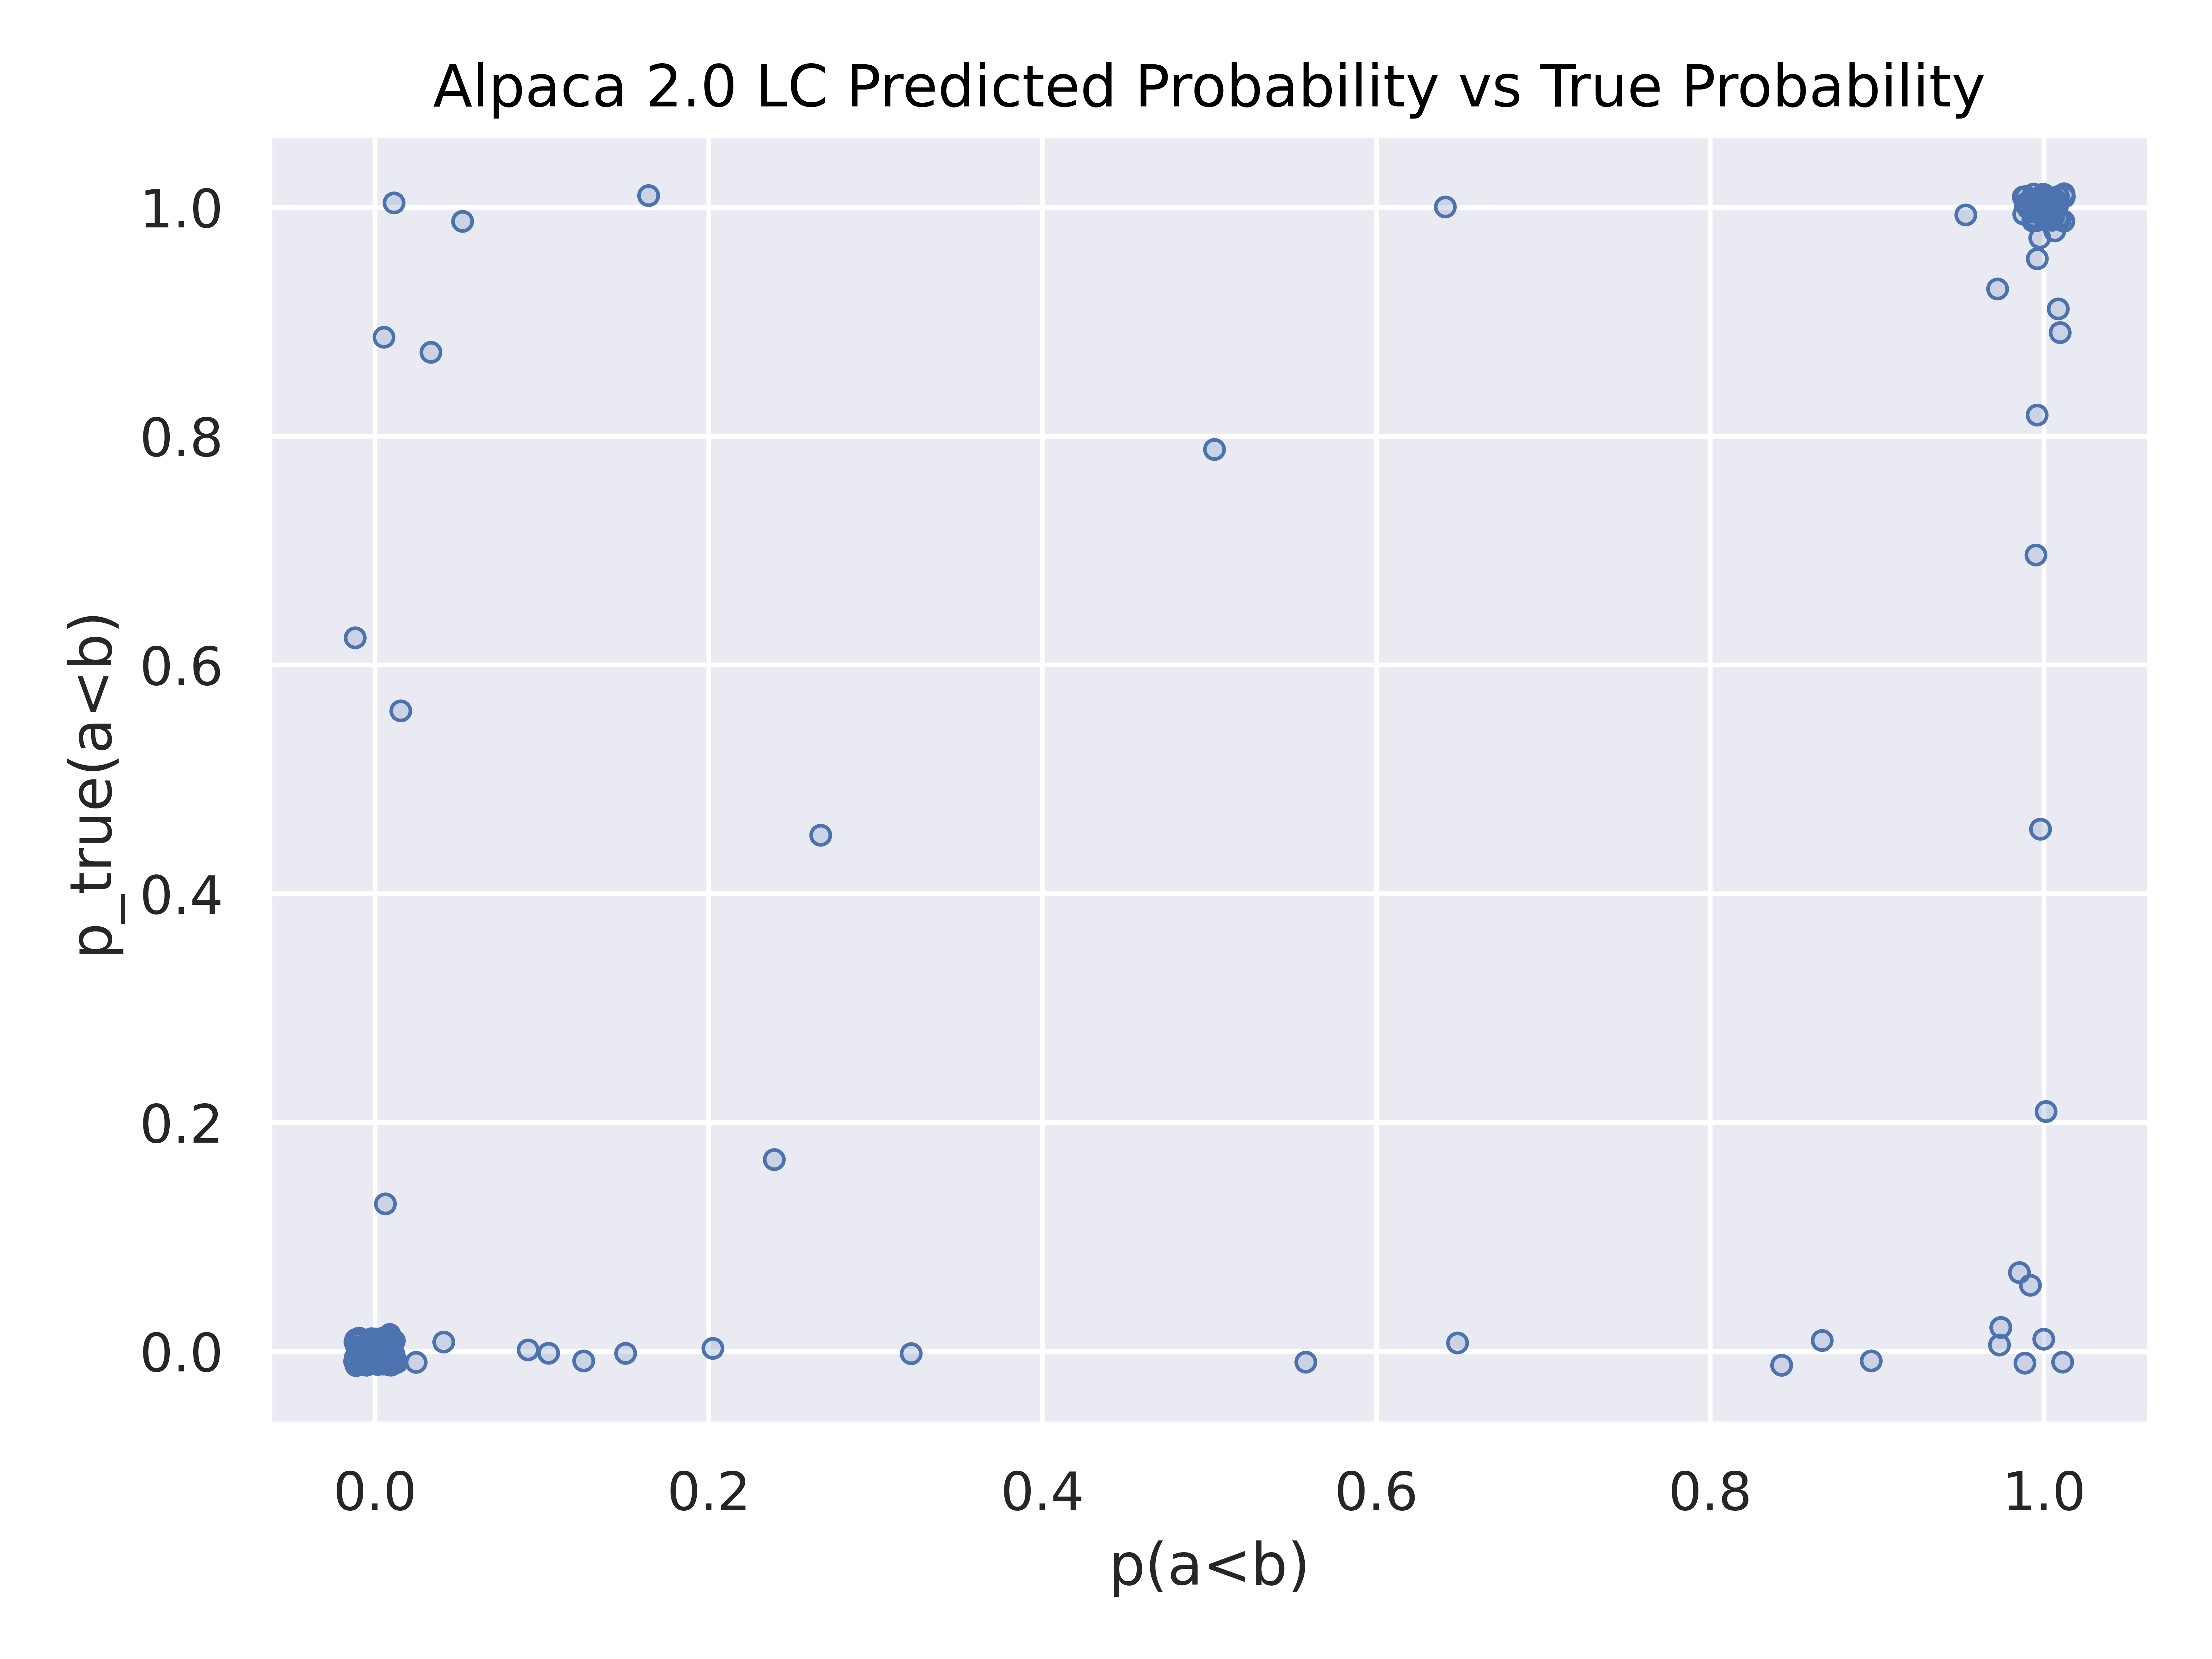
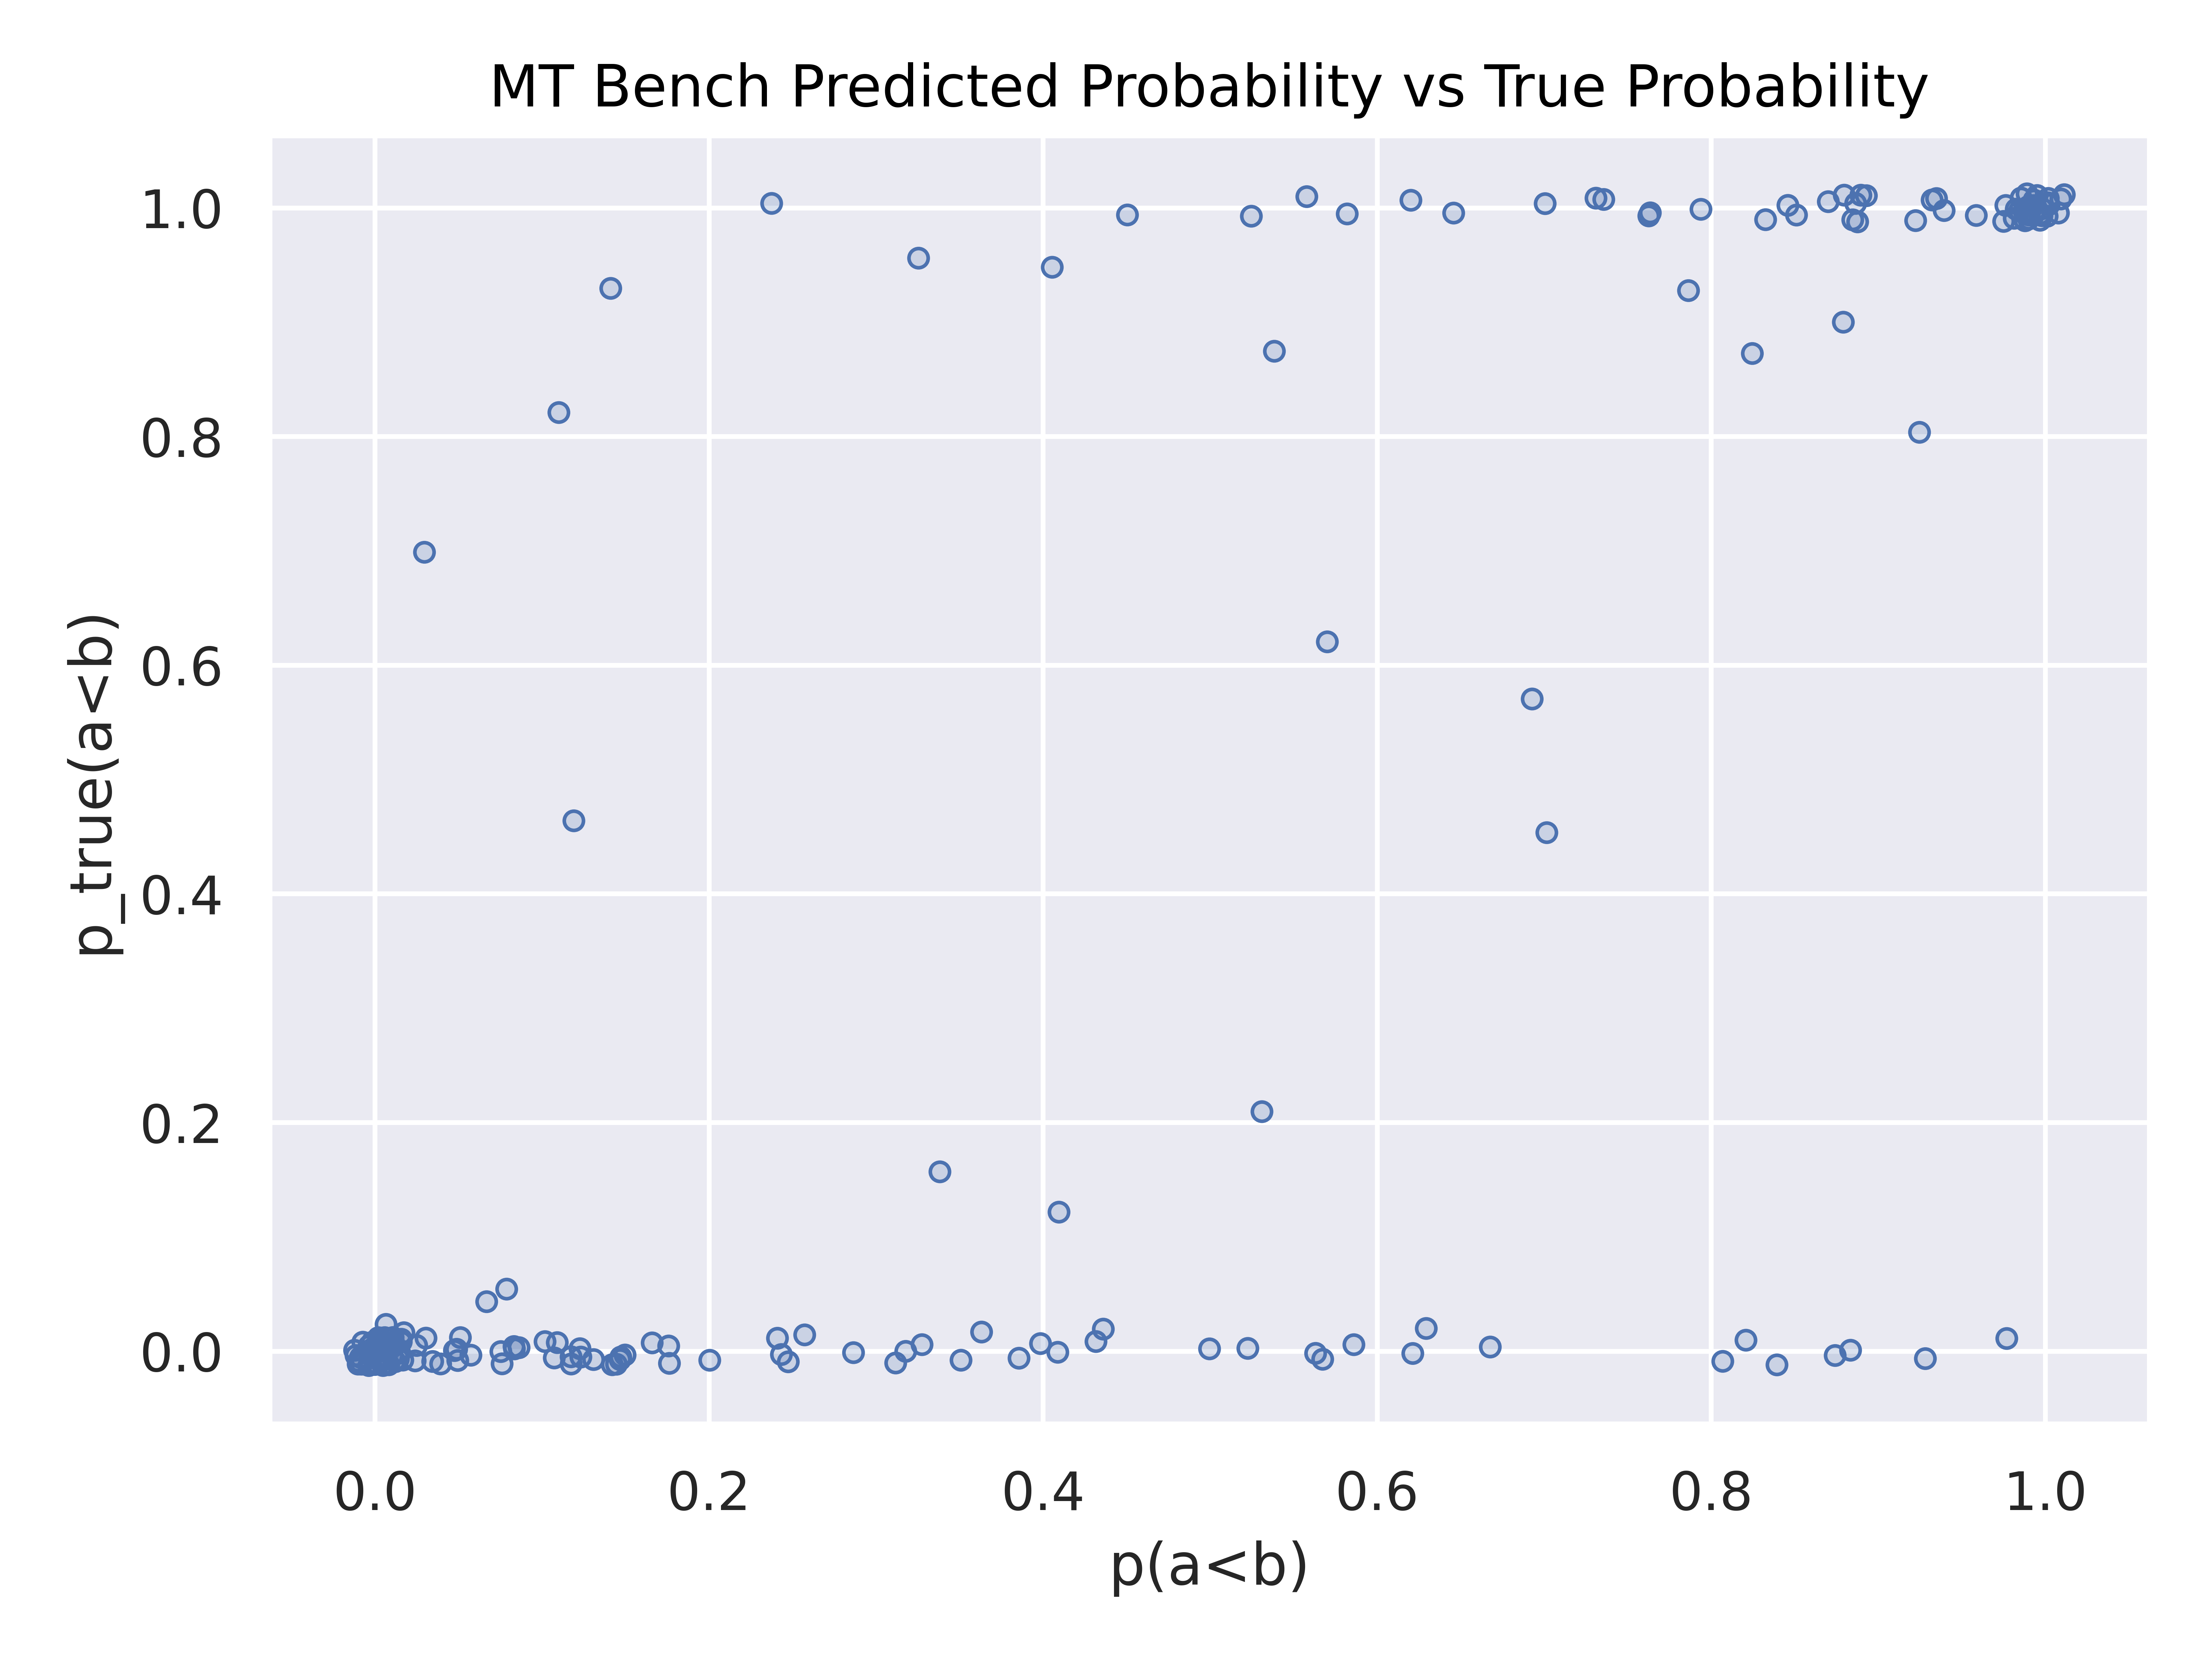
Above is the predicted model predicted probability against the bootstrapped arena “ground truth” probability (jittered to show clusters). While both Alpaca eval and Arena Hard Auto have large clusters around (0,0) and (1,1) signifying good forecasting, Arena Hard Auto has lighter clusters on (0,1) and (1,0), if any, revealing less overconfidence. MT Bench has heavy tails along the top and bottom, revealing underconfidence. However, none of these benchmarks show an “ideal” y=x curve (with dense ends) expected with a perfectly calibrated forecast, signifying room for future research.
Future
We hope to study deeper into the above limitations and biases in the later technical report. We are also working on diving deeper into the statistics for more studies on how to measure the quality of benchmarks. Lastly, we also hope to upgrade Arena-Hard frequently. So expect frequent new benchmarks!
Acknowledgment
We thank Matei Zaharia, Yann Dubois, Anastasios Angelopoulos, Lianmin Zheng, Lewis Tunstall, Nathan Lambert, Xuechen Li, Naman Jain, Ying Sheng, Maarten Grootendorst for their valuable feedback. We thank Siyuan Zhuang and Dacheng Li for the valuable review and debug of the code. We thank Microsoft AFMR for Azure OpenAI credits support. We also thank Together.ai & Anyscale for open model endpoint support.
Citation
If you find Arena-Hard-Auto or BenchBuilder useful, please cite our papers below.
@misc{li2024crowdsourced,
      title={From Crowdsourced Data to High-Quality Benchmarks: Arena-Hard and BenchBuilder Pipeline},
      author={Tianle Li and Wei-Lin Chiang and Evan Frick and Lisa Dunlap and Tianhao Wu and Banghua Zhu and Joseph E. Gonzalez and Ion Stoica},
      year={2024},
      eprint={2406.11939},
      archivePrefix={arXiv},
      primaryClass={cs.LG}
}

@misc{chiang2024chatbot,
    title={Chatbot Arena: An Open Platform for Evaluating LLMs by Human Preference},
    author={Wei-Lin Chiang and Lianmin Zheng and Ying Sheng and Anastasios Nikolas Angelopoulos and Tianle Li and Dacheng Li and Hao Zhang and Banghua Zhu and Michael Jordan and Joseph E. Gonzalez and Ion Stoica},
    year={2024},
    eprint={2403.04132},
    archivePrefix={arXiv},
    primaryClass={cs.AI}
}

@misc{arenahard2024,
    title = {From Live Data to High-Quality Benchmarks: The Arena-Hard Pipeline},
    url = {https://lmsys.org/blog/2024-04-19-arena-hard/},
    author = {Tianle Li*, Wei-Lin Chiang*, Evan Frick, Lisa Dunlap, Banghua Zhu, Joseph E. Gonzalez, Ion Stoica},
    month = {April},
    year = {2024}
}
Appendix
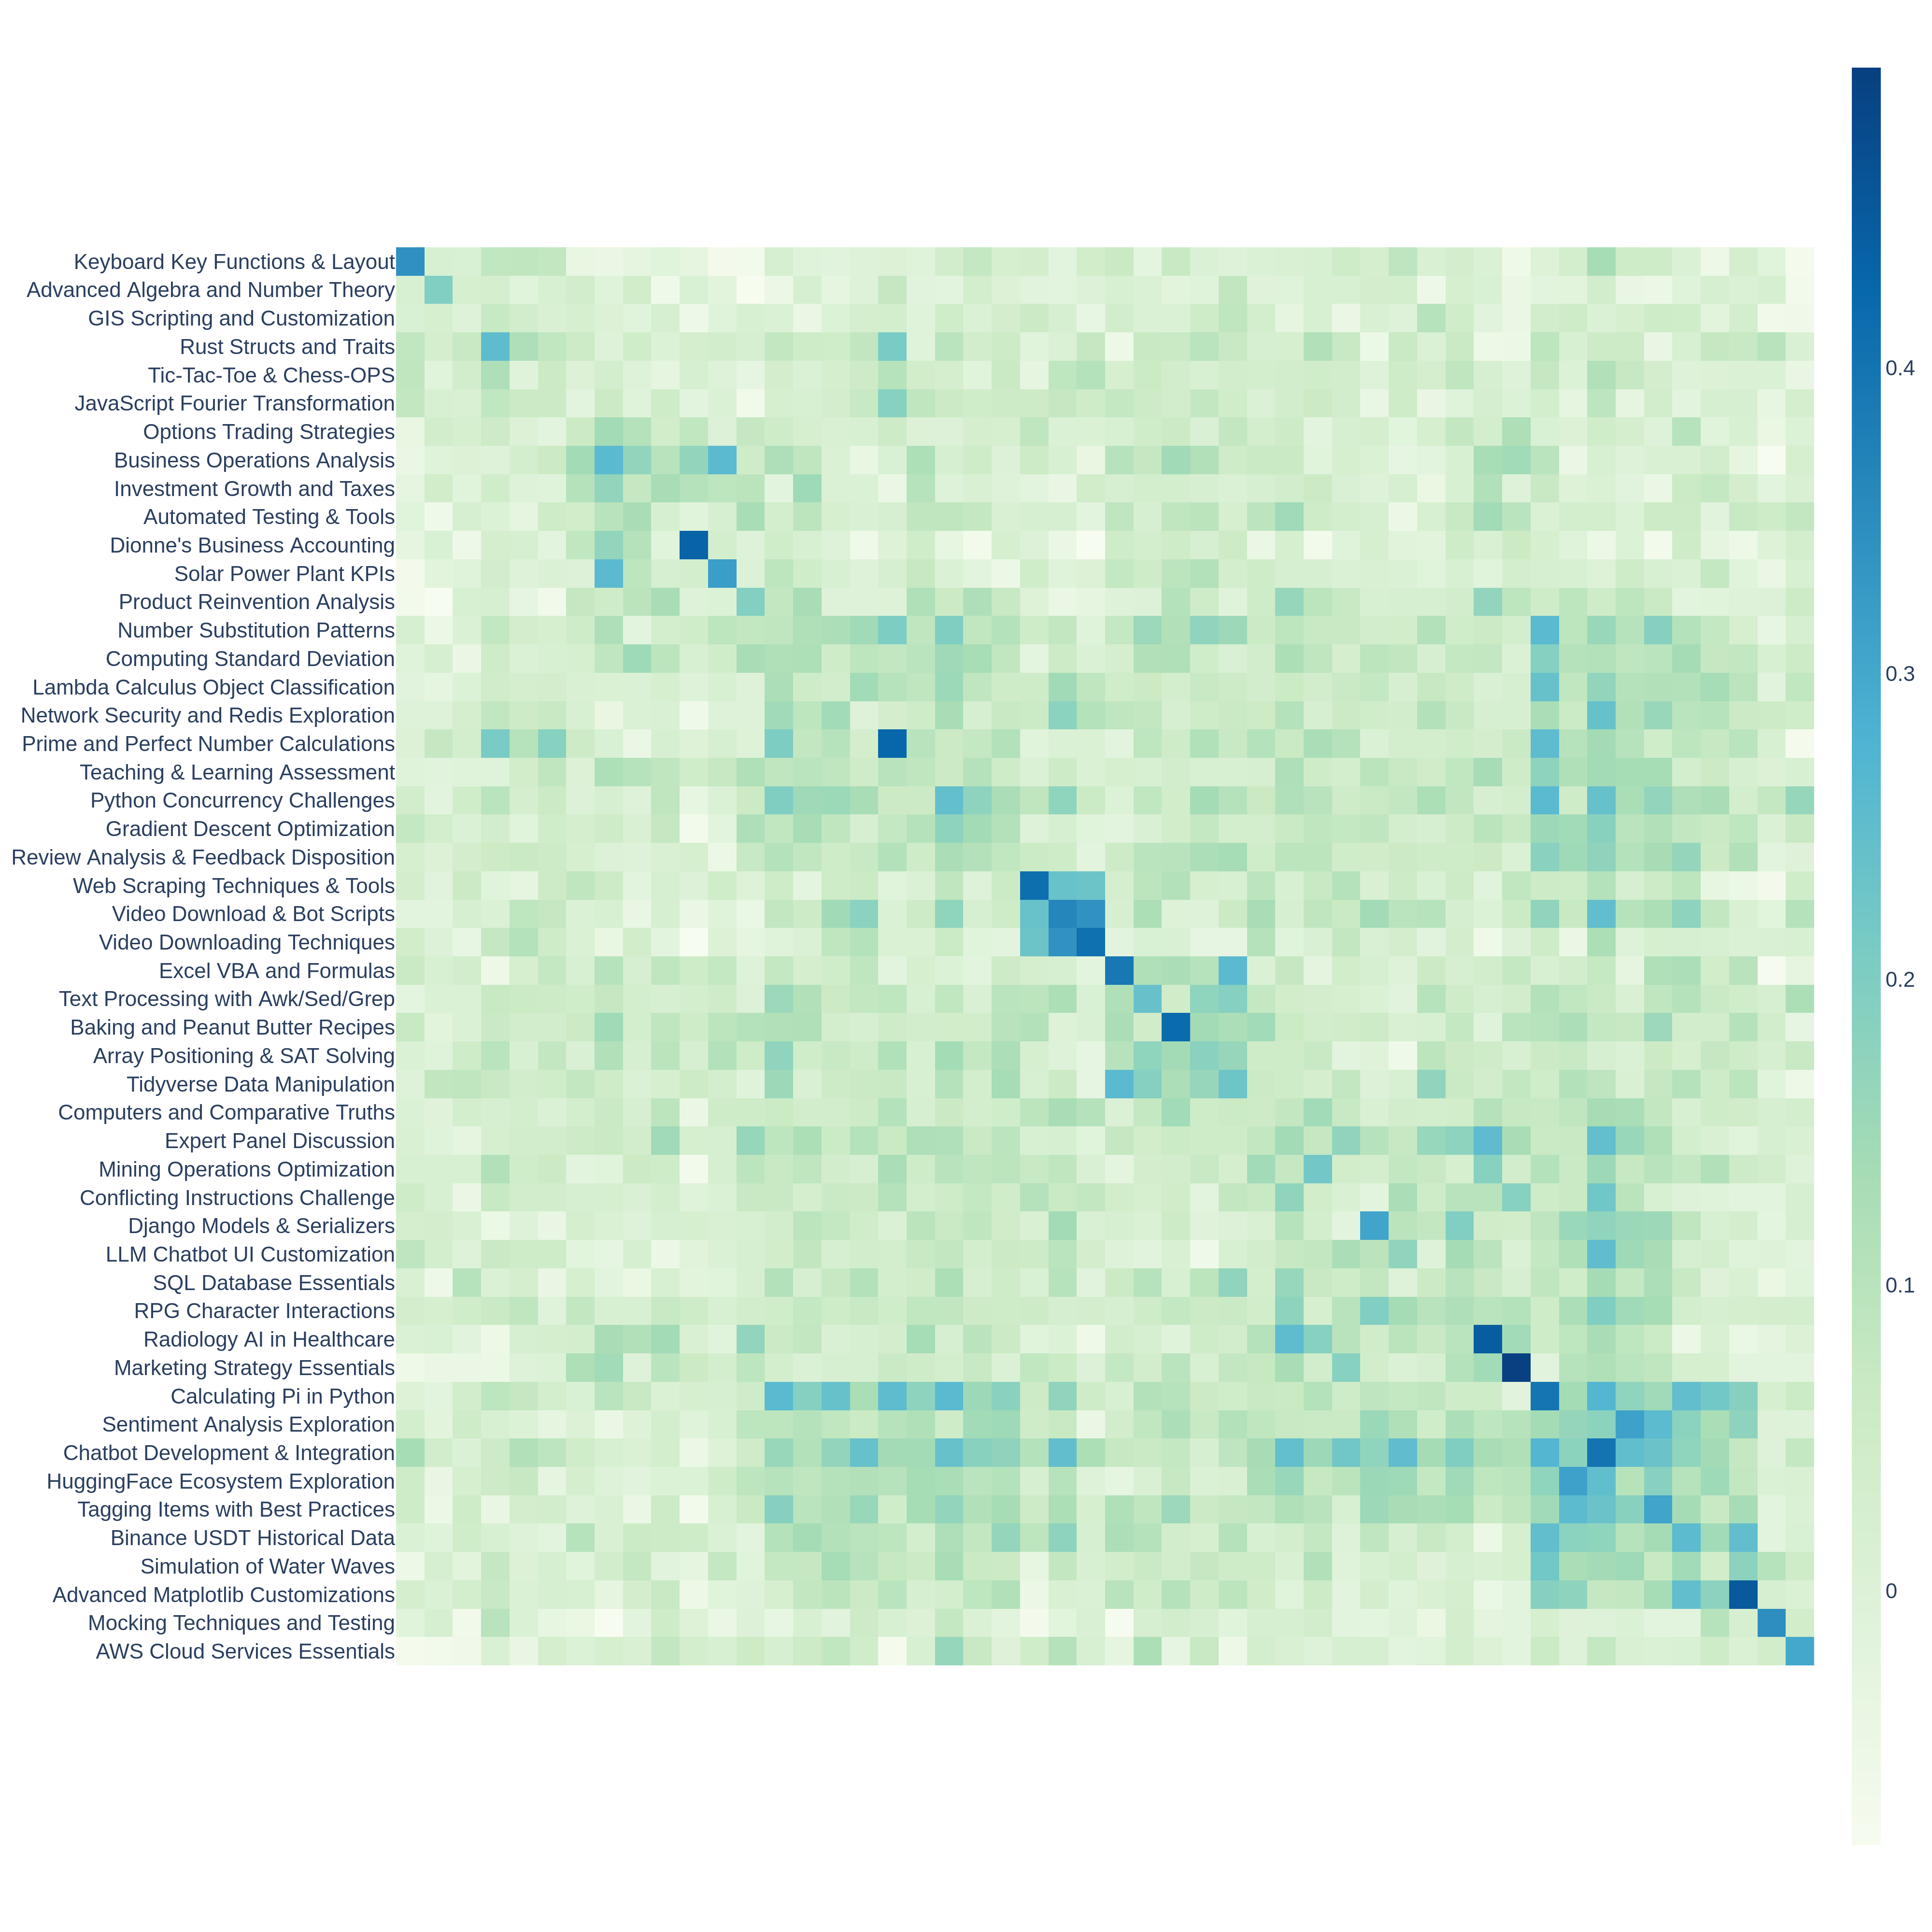
Appendix Figure 1: Similarity Heatmap of 50 Arena Hard Auto v0.1 Clusters
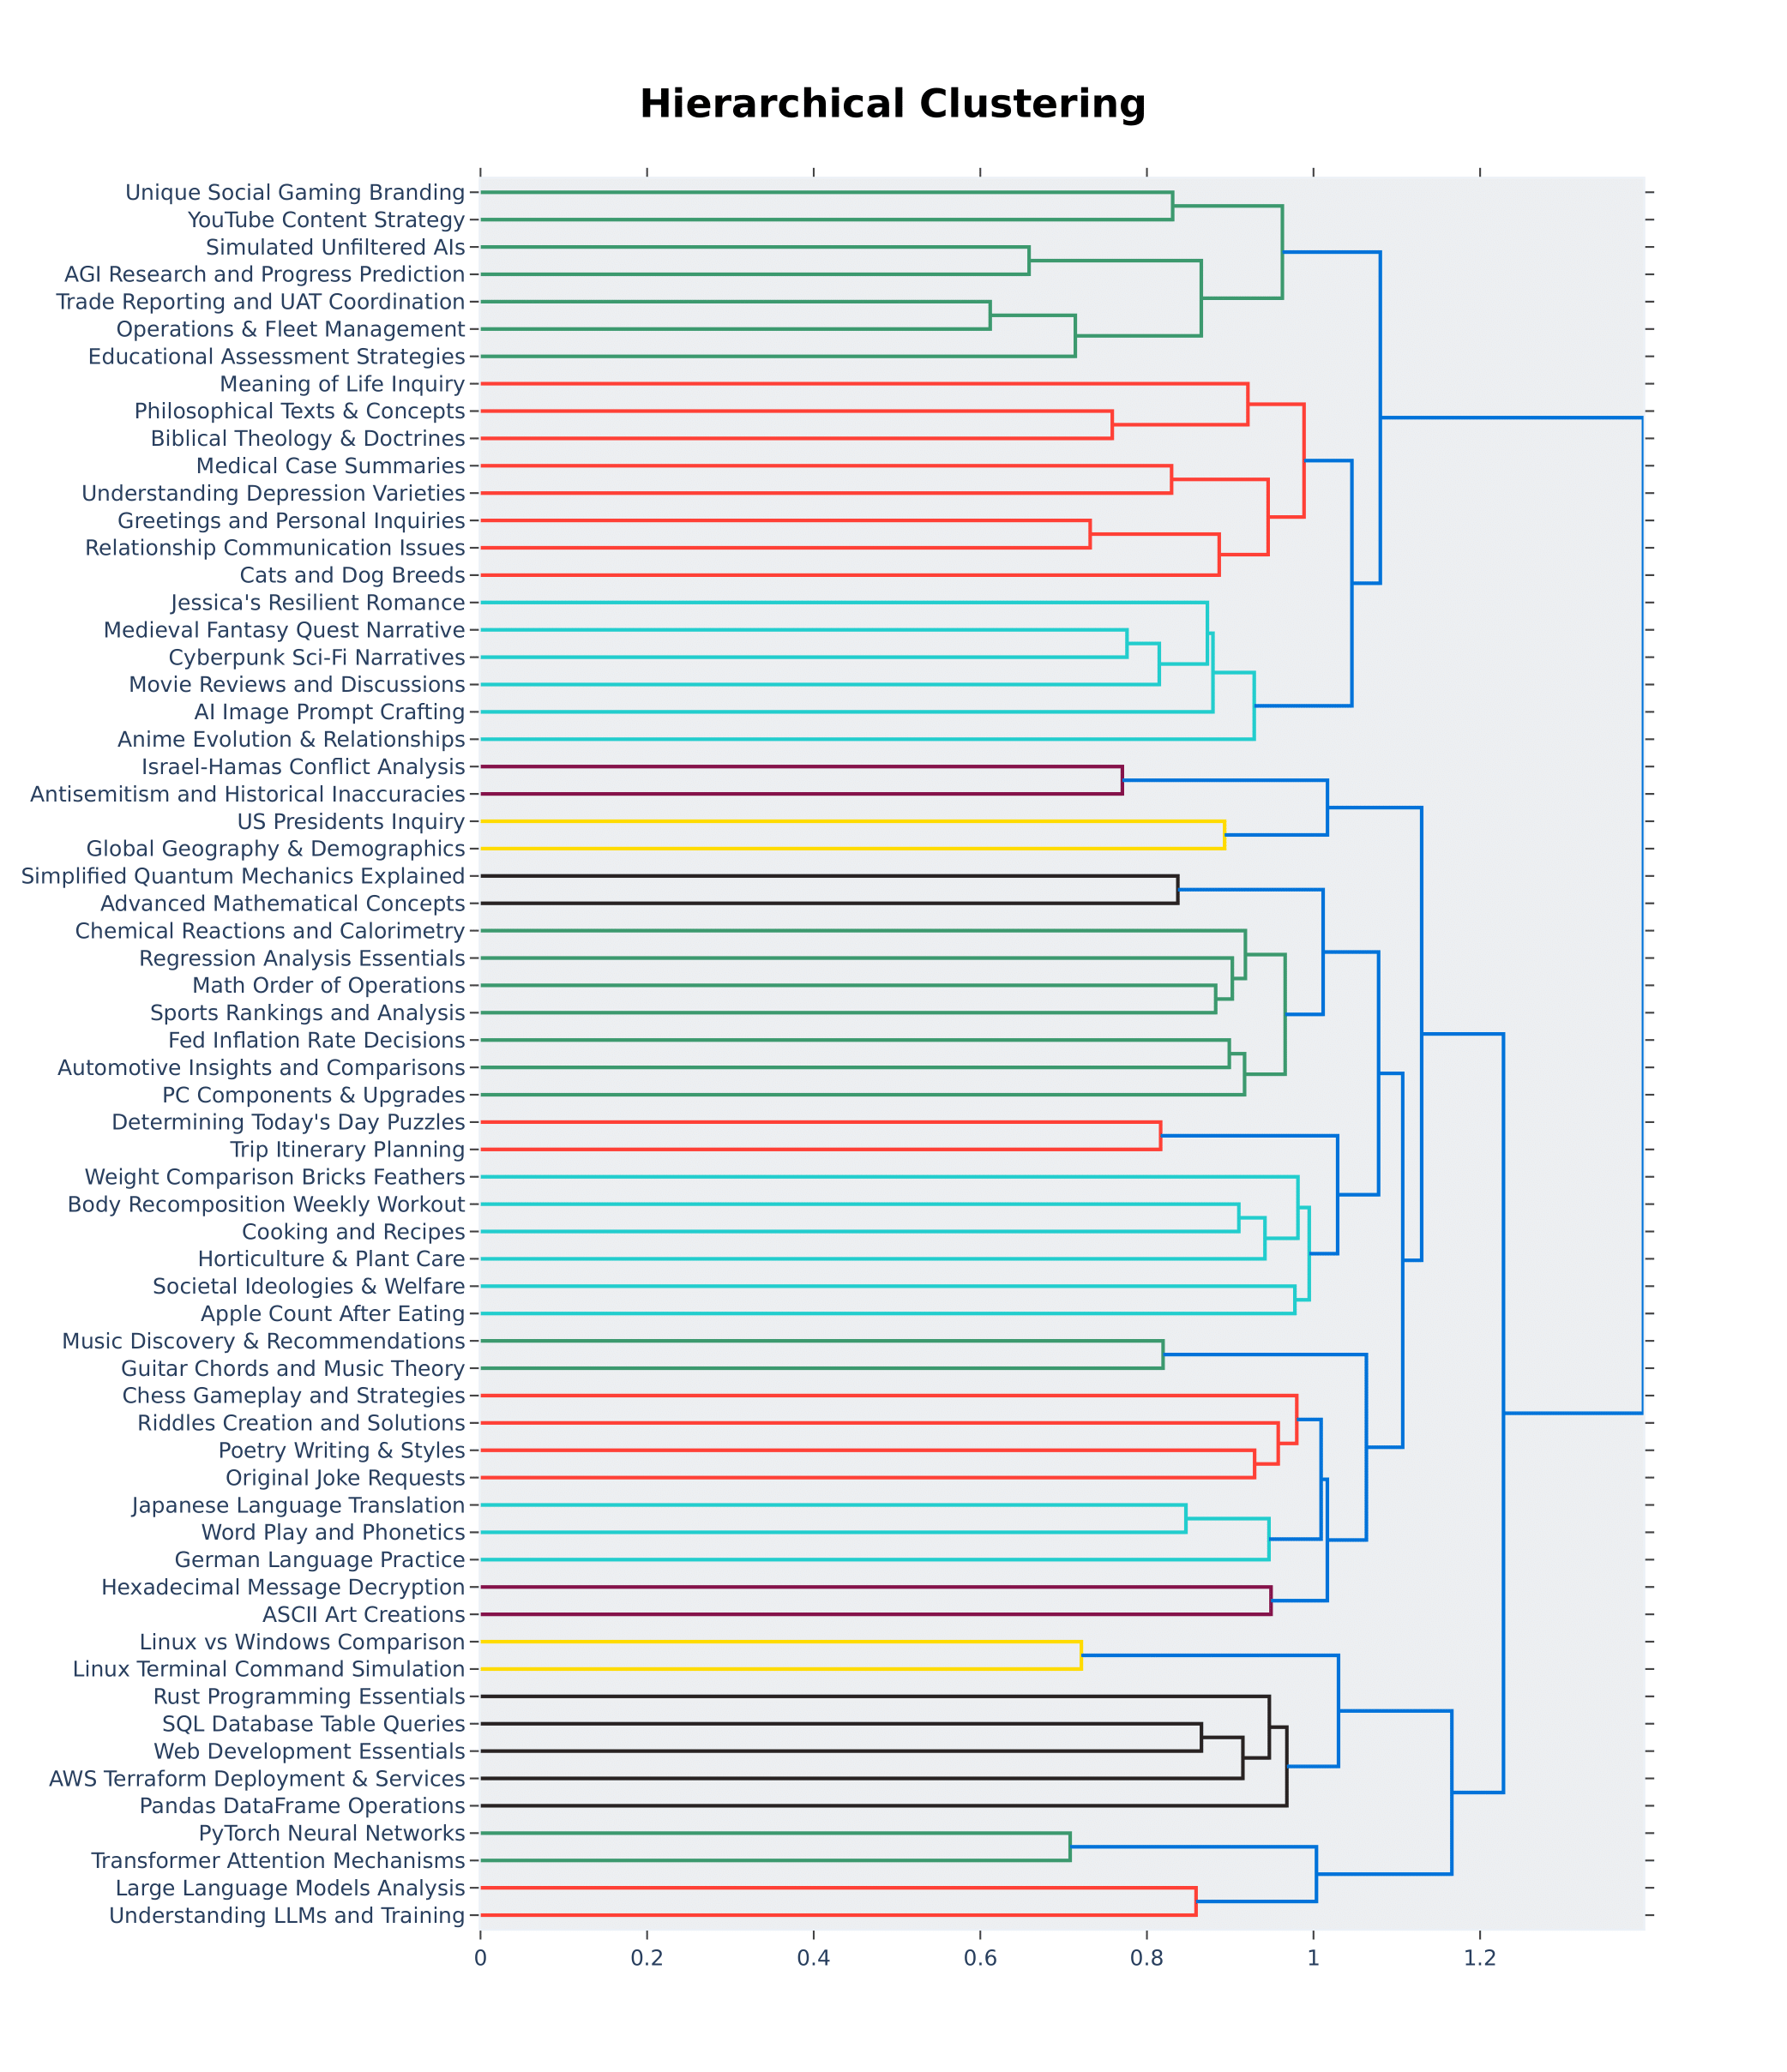
Appendix Figure 2: Top-64 clusters visualized in hierarchy. x-axis represents the cosine similarity distance. y-axis shows the topic title per cluster summarized by gpt-4-turbo.